
McKinsey Solve Scoring: How the Assessment Is Graded (2026)
Learn exactly how McKinsey Solve is scored — from percentile rankings to the specific factors measured in each game.
How McKinsey Solve Scoring Actually Works
Here's the uncomfortable truth about McKinsey Solve scoring: McKinsey has never published an official scoring rubric. There's no score report emailed to you after the test. You either advance to the next round or you don't.
But after analyzing thousands of candidate outcomes and studying the assessment's mechanics, we know far more about McKinsey Solve grading than most applicants realize. This guide breaks down every scoring dimension we've identified — across the Sea Wolf game, Red Rock Study, the newer Sustainable Future Lab, and the legacy Ecosystem Game — so you can focus your preparation on what actually moves the needle.
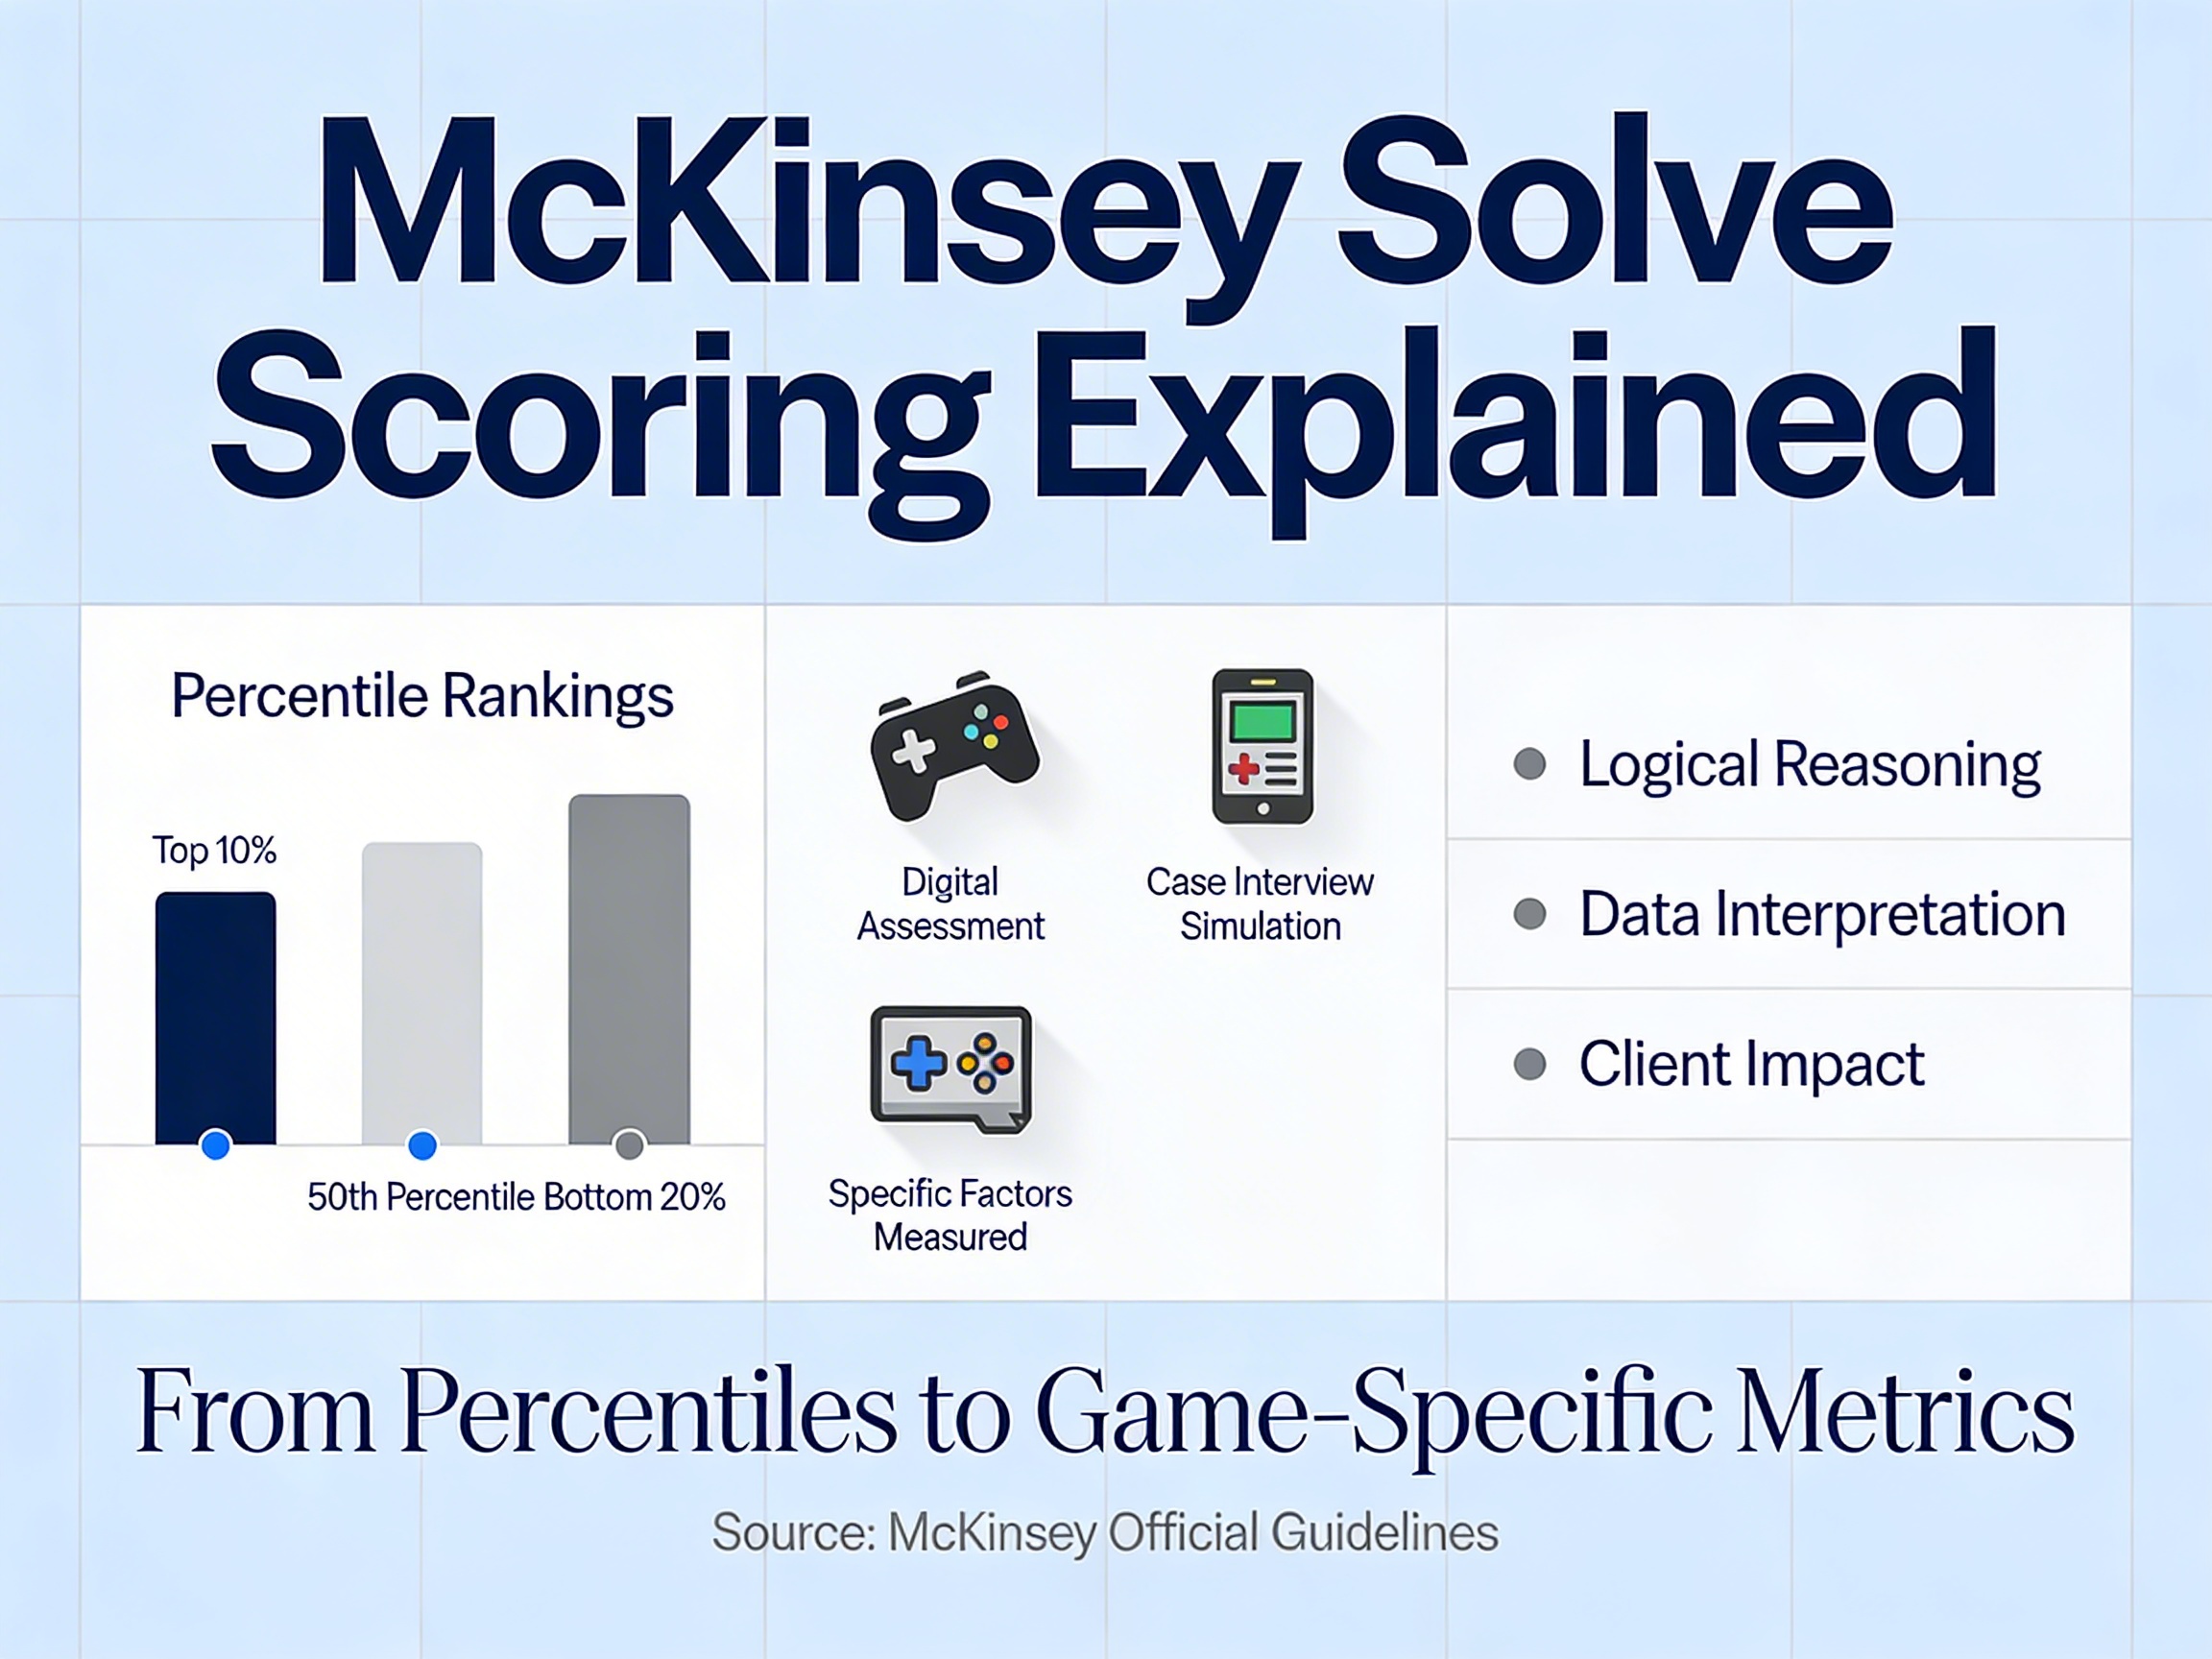
The single most important concept: McKinsey Solve uses percentile-based scoring, not absolute scores. You aren't graded against a fixed standard. You're ranked against every other candidate who has taken the assessment. That distinction changes how you should prepare.
Percentile-Based Scoring: You're Competing Against Everyone
Unlike a standardized test where 80% correct means you passed, McKinsey Solve ranks your performance relative to the full candidate pool. Think of it like grading on a curve — except the curve includes candidates from 150+ countries applying to one of the most selective employers on the planet.
This means two things:
A "good" performance is relative. Solving the Sea Wolf game competently isn't enough if 70% of candidates solve it more efficiently than you did.
The difficulty adjusts itself. Because scoring is relative, McKinsey doesn't need to make the games harder or easier across cycles. The candidate pool itself sets the bar.
McKinsey reportedly combines your scores across the games you're assigned into a composite percentile. For most candidates that means Sea Wolf plus Red Rock, with Sustainable Future Lab appearing as an additional behavioral component in newer administration cycles. No single game is officially weighted more heavily than the others, though candidate data suggests the analytical games (Sea Wolf, Red Rock) contribute the bulk of the analytical ranking.
What McKinsey Measures: Three Core Dimensions
McKinsey hasn't published its exact algorithm, but the assessment's design and candidate outcome patterns point to three scoring dimensions that apply across all games:
1. Product Quality (Your Final Answer)
This is the most heavily weighted dimension. Did you arrive at the right outcome? In the Sea Wolf game, this means: did you build a stable, optimized marine ecosystem? In the Red Rock Study, it means: did you correctly identify the geological patterns and reach accurate conclusions?
Product quality isn't binary. There's a spectrum between "completely wrong" and "perfectly optimized." A Sea Wolf ecosystem that's 85% optimal scores meaningfully higher than one that's 60% optimal — even if both technically "work."
2. Process Efficiency (How You Got There)
McKinsey tracks your decision-making path, not just your destination. The Solve assessment records every click, every selection, every revision. Candidates who move methodically toward an optimal solution — without excessive backtracking, random guessing, or circular decision patterns — score higher on process metrics.
This is where many strong candidates lose points. They arrive at a decent answer but take a chaotic path to get there: selecting a species, removing it, re-adding it, swapping it for something else, then reverting. That pattern signals uncertainty, and the algorithm penalizes it.
3. Time Management (Speed as a Tiebreaker)
Speed matters, but it's the least weighted of the three dimensions. Finishing with 10 minutes to spare doesn't help you if your ecosystem collapses or your data interpretation is wrong. However, between two candidates with equally strong outcomes and equally clean processes, the faster candidate will rank higher.
Think of it as a tiebreaker, not a primary scoring factor. We'll cover this in more detail below.
Sea Wolf Scoring Factors
The Sea Wolf game asks you to build and sustain a marine ecosystem by selecting species, managing environmental variables, and maintaining population balance over simulated time periods. Here's what drives your score:
Species Selection Accuracy
The core of your Sea Wolf score. Each species has specific requirements — depth range, temperature tolerance, caloric needs, predator-prey relationships. Selecting species that are compatible with the environment and with each other is the primary scoring driver.
Candidates who pick species based on systematic analysis of the data provided (habitat requirements, food chain positioning, environmental conditions) outperform those who rely on intuition or trial-and-error. The Sea Wolf Solver tool can help you practice identifying optimal species combinations before test day.
Ecosystem Stability Over Time
It's not enough to build an ecosystem that works at the moment of submission. The simulation projects your ecosystem forward, and species populations need to remain viable. An ecosystem where one predator wipes out its prey within three simulated cycles scores lower than one that maintains balanced populations indefinitely.
Stability is a function of food chain completeness, population ratios, and environmental fit. Missing a key producer at the base of the food chain — even if every other species looks correct — can cascade into total ecosystem failure.
Resource Efficiency
Did you use the available resources (species slots, terrain features, environmental settings) effectively? An ecosystem that achieves stability with fewer adjustments and more deliberate choices signals stronger problem-solving ability. Over-engineering — adding unnecessary species or making redundant environmental changes — can actually lower your process score.
Red Rock Study Scoring Factors
The Red Rock Study presents geological data sets and asks you to analyze patterns, test hypotheses, and draw conclusions about rock formations. The scoring emphasis shifts toward analytical reasoning:
Data Interpretation Accuracy
Can you read the charts, tables, and geological data correctly? This sounds basic, but the Red Rock Study deliberately presents complex, multi-variable data sets where surface-level reading leads to wrong conclusions. Candidates who identify the correct patterns — distinguishing correlation from noise — score highest on this dimension.
Hypothesis Quality
Red Rock doesn't just test whether you can read data. It tests whether you can form and evaluate hypotheses. The assessment tracks which hypotheses you investigate, in what order, and whether your final conclusion logically follows from the evidence you examined.
Strong candidates eliminate incorrect hypotheses systematically rather than jumping to a conclusion after examining one data set. Weak candidates fixate on the first pattern they notice and ignore contradicting evidence.
Analytical Completeness
Did you examine enough of the available data to support your conclusion? Candidates who base their final answer on a single data view — when three or four views were available — score lower than those who triangulate across multiple sources. This dimension rewards thoroughness without rewarding aimless clicking.
Sustainable Future Lab Scoring Factors
The Sustainable Future Lab (SFL) is the newest McKinsey Solve game and shifts the focus from pure analytics to applied judgment. You're placed in a sustainability-themed business scenario and asked to make a sequence of decisions — choosing actions, prioritizing stakeholders, and responding to evolving conditions. The scoring rewards reasoning quality and consistency rather than a single "correct" answer.
Behavioral Judgment Quality
SFL presents situational prompts where multiple actions look plausible. Higher scorers select responses that balance short-term feasibility with long-term impact — and that align with the role they've been placed in. Choices that ignore the brief, optimize for a single metric, or rely on extreme actions are penalized.
Stakeholder Reasoning & Trade-Off Handling
Each scenario involves multiple stakeholders (community, business, regulators, environment) whose interests don't fully align. The algorithm rewards candidates who weigh competing interests explicitly rather than defaulting to whichever stakeholder appears first. Trade-offs that acknowledge downsides outscore choices that pretend trade-offs don't exist.
Consistency Across Scenarios
Because SFL spans several connected vignettes, your earlier choices set context for later ones. Candidates whose decisions tell a coherent story — same values, same priorities, same risk tolerance throughout — score higher than those who flip-flop. Inconsistency reads as poor judgment, even when individual answers look reasonable in isolation.
Ecosystem Game Scoring Factors (Legacy)
The Ecosystem Building game was the original McKinsey Solve assessment but has been deprecated in favor of the current Sea Wolf and Red Rock format. Some candidates may still encounter references to it, so here's how it was scored:
Food Chain Viability
The primary scoring factor. You needed to construct a complete food chain — from producers to apex predators — where every organism had a viable food source and appropriate habitat conditions. Incomplete chains or chains with broken links scored poorly regardless of other factors.
Species Relationship Accuracy
Each species had defined relationships: predator, prey, competitor, or neutral. Selecting species with compatible relationships and arranging them correctly within the food chain was critical. Placing a species that competed with its only food source, for example, would destabilize the entire chain.
Environmental Matching
Species needed to fit their assigned terrain and climate conditions. A cold-water organism placed in a warm environment wouldn't survive, even if its food chain position was correct. This dimension tested attention to detail in the provided species data cards.
Scoring Factors by Game: Summary
| Scoring Factor | Sea Wolf | Red Rock Study | Sustainable Future Lab | Ecosystem (Legacy) |
|---|---|---|---|---|
| Primary metric | Species selection accuracy | Data interpretation accuracy | Behavioral judgment quality | Food chain viability |
| Secondary metric | Ecosystem stability over time | Hypothesis quality & reasoning | Stakeholder & trade-off reasoning | Species relationship accuracy |
| Tertiary metric | Resource efficiency | Analytical completeness | Consistency across scenarios | Environmental matching |
| Process tracked? | Yes — click patterns, revisions | Yes — investigation order, hypothesis path | Yes — choice sequence & revisions | Yes — construction sequence |
| Speed impact | Low-moderate (tiebreaker) | Low-moderate (tiebreaker) | Low (tiebreaker) | Low-moderate (tiebreaker) |
| Time limit | ~35 minutes | ~35 minutes | ~20-25 minutes | ~35 minutes |
Does Speed Matter on McKinsey Solve?
Yes — but far less than most candidates assume. Here's the honest breakdown:
Speed is approximately the third most important factor behind answer quality and process efficiency. Rushing through the Sea Wolf game to finish in 20 minutes while building a suboptimal ecosystem will score worse than taking 33 minutes to build a near-perfect one.
That said, speed isn't irrelevant. The assessment does record your completion time, and between two candidates with identical outcomes and process patterns, the faster candidate gets the edge. Estimated impact: speed likely accounts for 10–20% of your total score weighting, compared to 50–60% for product quality and 20–30% for process efficiency.
The practical takeaway: don't rush, but don't waste time either. Avoid spending five minutes deliberating over a single species choice. Develop a systematic approach through simulation practice so your decision-making is fast because it's well-practiced, not because you're cutting corners.
What Percentile Do You Need to Pass?
McKinsey doesn't publish a pass/fail threshold. Based on aggregated candidate outcomes across multiple application cycles, here's our best estimate:
Top 25–30% of candidates is the approximate passing threshold for most offices
Top 15–20% appears to be the threshold for the most competitive offices (New York, London, Dubai)
Top 10% virtually guarantees advancement to the interview round (assuming your resume also cleared)
These are estimates, not confirmed cutoffs. McKinsey likely adjusts thresholds based on application volume, office needs, and candidate pool quality in any given cycle.
One important nuance: your Solve score doesn't exist in isolation. McKinsey evaluates it alongside your resume, cover letter, and referral status. A borderline Solve score with a strong resume from a target school may still advance. A borderline Solve score from a non-target school with no referral probably won't.
The safest strategy? Don't aim for "good enough." Aim for top 15%. That gives you a buffer regardless of office competitiveness. Practicing with the Sea Wolf simulation and the complete McKinsey Solve simulation is the most reliable way to push your performance into that range.
How to Maximize Your Score
Based on everything above, here's what moves the needle most:
Prioritize accuracy over speed. Get the right answer, then optimize your time. Never sacrifice quality for pace.
Move methodically. Avoid backtracking. Make deliberate choices and commit to them. The algorithm rewards clean decision paths.
Use all available data. In Red Rock, examine multiple data views before concluding. In Sea Wolf, check species requirements against every environmental variable — not just the obvious ones.
Practice under timed conditions. Speed improves naturally when your approach is well-rehearsed. Simulation practice at SeaWolfSolver.com builds the pattern recognition that makes you faster without trying to be.
Understand the scoring model. You're reading this article, so you're already ahead. Knowing that process efficiency is tracked changes how you approach the games.
Frequently Asked Questions
How is the McKinsey Solve scored?
McKinsey Solve uses percentile-based scoring. Your performance is ranked against all other candidates who have taken the assessment, rather than measured against a fixed benchmark. Your composite score combines results across the games you're assigned (typically Sea Wolf and Red Rock, with Sustainable Future Lab added in newer cycles), with primary emphasis on answer quality, secondary emphasis on decision-making process, and a smaller weight on completion speed.
What score do you need to pass McKinsey Solve?
There's no officially published passing score. Based on candidate outcome data, the estimated passing threshold is approximately the top 25–30% of all test-takers, with more competitive offices (New York, London) likely requiring top 15–20%. These estimates can shift based on application volume and candidate pool quality.
Does McKinsey tell you your Solve score?
No. McKinsey does not share individual scores, percentiles, or any performance breakdown from the Solve assessment. Candidates receive only a pass/fail outcome communicated through their recruiter, typically within 1–2 weeks of completing the test.
Can you fail one game and still pass McKinsey Solve?
This is unlikely but theoretically possible. Since McKinsey uses a composite score across the games you're assigned, an exceptionally strong performance on one game can partially offset a weaker performance on another. In practice, the analytical games (Sea Wolf and Red Rock) carry comparable weight, and when Sustainable Future Lab is included it contributes an additional behavioral signal. A poor score on any one game makes passing significantly harder, so prepare for every game in your assigned battery — Sea Wolf, Red Rock, and Sustainable Future Lab.
Does McKinsey Solve track your mouse movements and clicks?
Yes. The assessment records your full interaction pattern — clicks, selections, revisions, time spent per decision, and navigation path. This data feeds into the "process efficiency" scoring dimension. Erratic behavior, excessive backtracking, and random clicking patterns negatively impact your score even if your final answer is correct.
Is the McKinsey Solve harder than the old PST?
They test fundamentally different things. The Problem Solving Test (PST) was a traditional multiple-choice math and logic test. McKinsey Solve assesses problem-solving through interactive simulations, which means strong test-takers don't automatically excel. The Solve rewards spatial reasoning, data synthesis, and systematic decision-making — skills that are harder to cram for but very trainable through simulation practice.